City of Grand Junction: GIS Webmap Users Guide

Produced by the Information Technology GIS Team
Help Desk: (970) 256-4070
TABLE OF CONTENTS
GENERAL NAVIGATION AND TOOLS
NOTE: Mobile users may notice some differences in interface layout. Depending on the type of device and its screen size, some elements may move or change appearance. For example, on smaller devices, you may have to expand the Main Tool Bar to access all the tools. Some images on this page will have an associated link to an alternate mobile view. If you have additional questions, or if the layout on your device differs significantly from what is shown on this help page, please call the GIS Help Desk at the number provided at the top and the bottom of this page.
If you need accommodation to access City Services or files that meet
your needs (e.g. mapping, construction/devlopment plans, or to complete
an application or other documentation), staff are availible to assist
you by calling 970-256-4070. In adition, the City has resources availible:
Interpretation via live remote on-demand video, including ASL, is availible
in-person at all City Customer Service windows and during in-person appointments
scheduled with City staff.
For TTY, dial 800-2656 or 711 for the relay service, or use the TTY mode on your
cell phone.
Mobile View
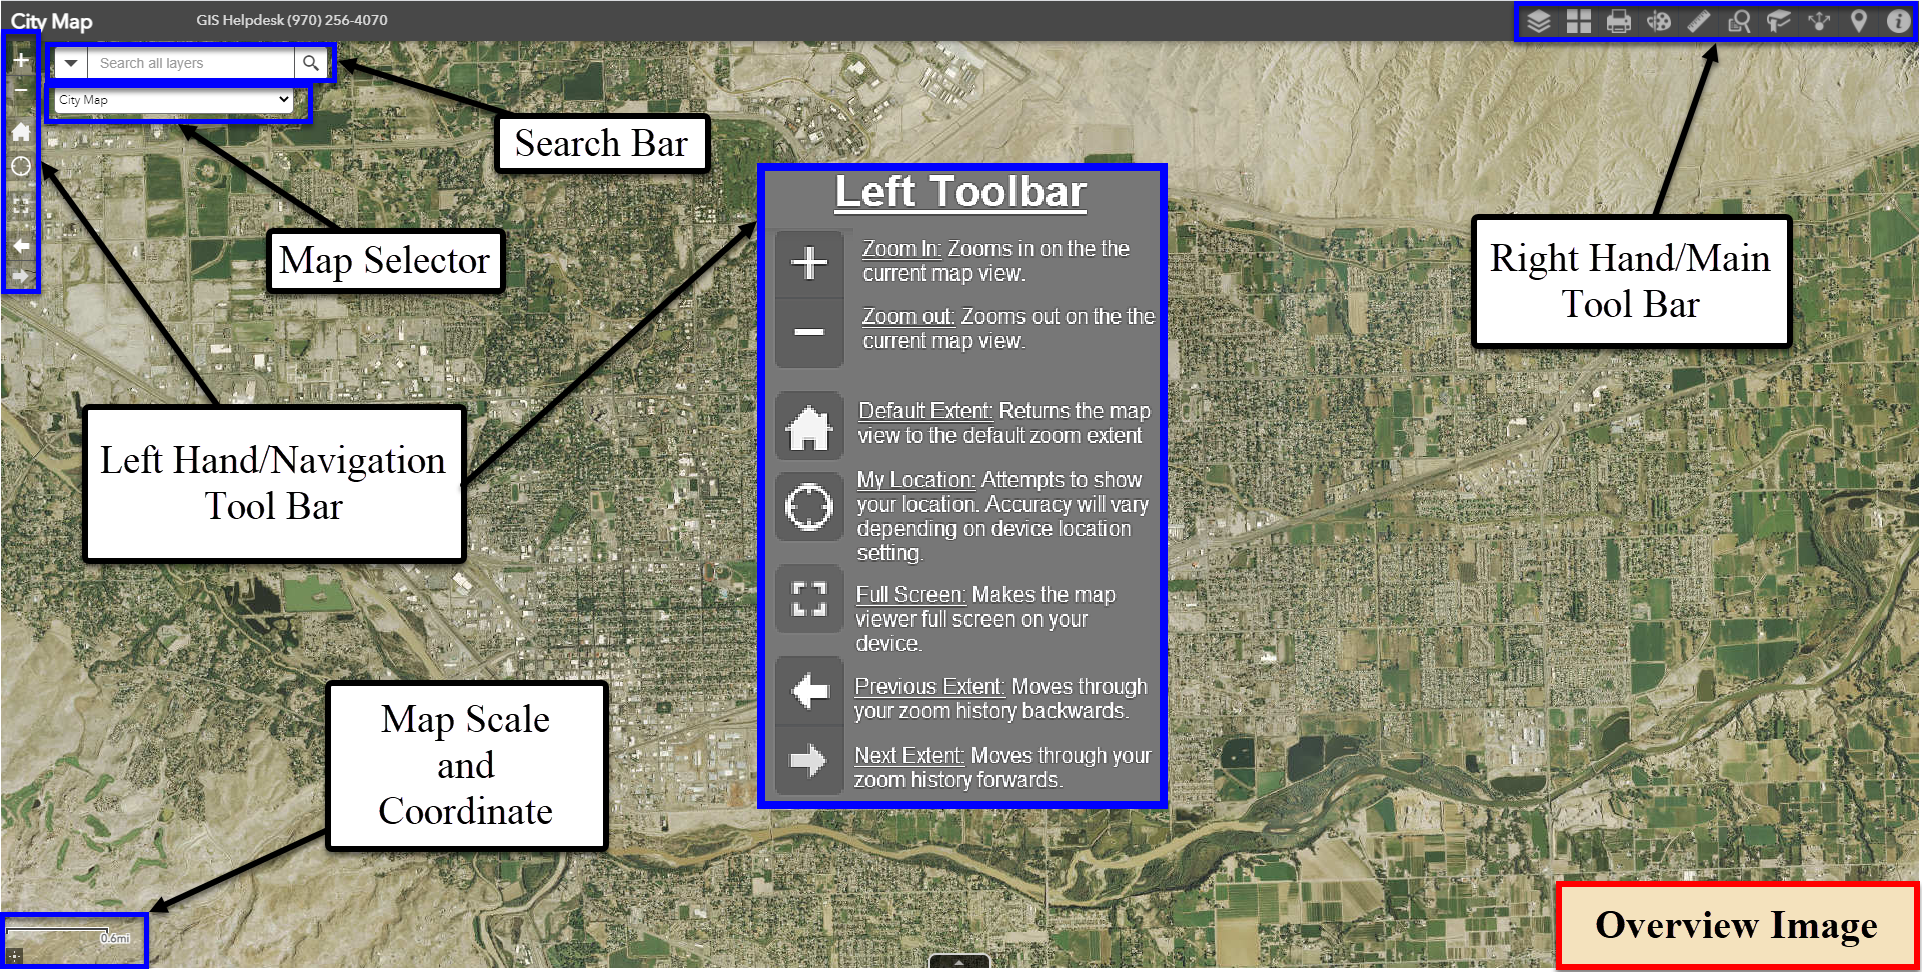
To pan and zoom using a desktop computer: use your left mouse button to click and drag around the map. There are a variety of tools on the Left-Hand Toolbar to help you navigate the map. In addition to the Zoom in/Zoom out buttons on the Left-Hand Toolbar, you can also use the wheel on your mouse to zoom in and out. In the lower left corner, there is a scale bar that displays your current scale. Below the scale bar is the coordinate tool in a small gray box. Clicking on this tool, then clicking a location on the map will display the coordinates of that point in the lower left corner. To pan and zoom on a mobile device: use one finger to drag around the map in a swiping motion. To zoom in and out, pinch two fingers inwards or drag two fingers outwards. The Left-Hand Toolbar behaves the same on desktop or mobile devices.
TOOLTIPS
Mobile View
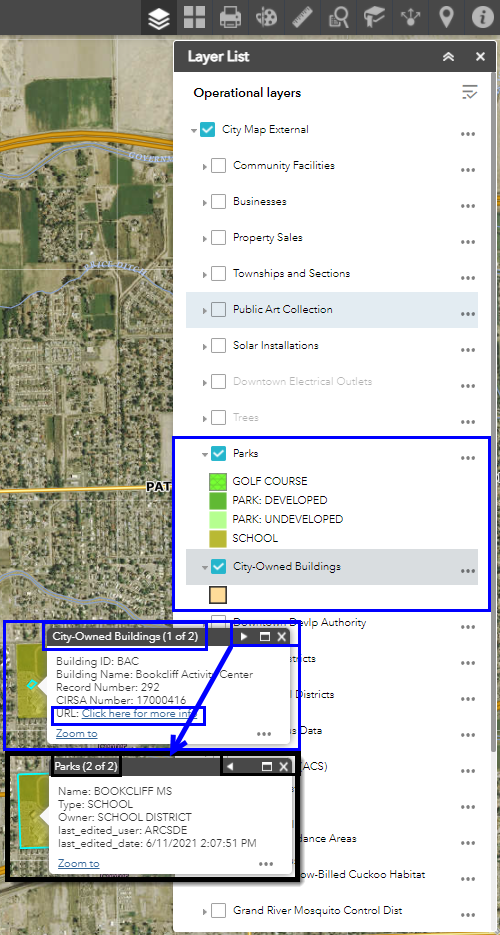
Tooltips are little menus that appear when you select a feature in the
map. In the Figure 5.1, the City-Owned Buildings layer and the Parks
layer are turned on, and a feature from one layer was selected.
The tooltip menus look different on the desktop map view and the mobile
map view. On desktop (shown on the right), a list of information appears
that you can page through using the arrow in the upper right corner of
the menu. If you click on a location where multiple layers overlap, like
in the example, the arrow in the top right allows you to scroll through
the information for every feature in the location you selected. The
ellipses (three dots) in the bottom right of the box will give you the
option to pan to the feature or place a marker.
On the mobile version, a smaller menu appears with little information.
To page through the results for that feature, click on the bottom arrow
next to the ‘1 of x’ text. To access information about that feature—like
the desktop version—click the arrow on the far right side of the menu.
When in the information screen, the ellipses (three dots) at the
bottom of the text will allow give you the option to pan to the
feature, or add a marker.
NOTE: A URL in the tooltip will open a new tab with either a website or
document with more information about the selected feature.
For Parcels, ‘URL: Click here for more info’ takes you to parcel
information on the Mesa County Assessors website.
SEARCH BAR
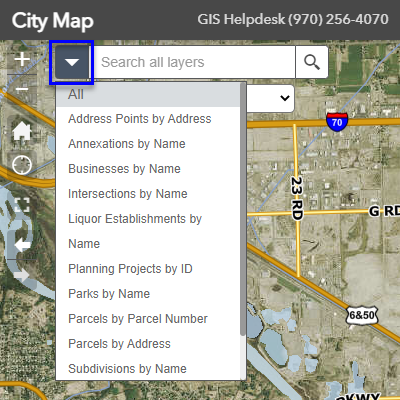

The Search Bar is located at the top left-hand corner of both the desktop and mobile versions of any map view. The Search Bar can be used to search addresses, subdivisions, parcels, businesses, and several other things. To narrow down your search, click the drop down arrow to the left of the Search Bar, as shown in Figure 2.1. The search options appear in the dropdown menu to filter your search with criteria, like ‘Name’, ‘Parcels by Address’, ‘Subdivisions by Name’, etc.
You do not have to type the full address for results to come up. For example, if you were trying to search for the location of City Hall using the address, 250 N 5th St, while leaving the dropdown search criteria under the default selection ‘All’, you would get the results shown in Figure 2.2.
Notice how the full address had not been typed in the Search Bar, yet the correct address for City Hall appeared.
A greater number of search results appear based on your search when the search criteria is left to the default ‘All’, but the search may take longer to return results. The results are grouped by the available search by criteria mentioned above.
NOTE: The results for a search will be the same no matter which map you are viewing (City Map, Development, Public Safety, etc.).
SWITCHING MAPS
Mobile View
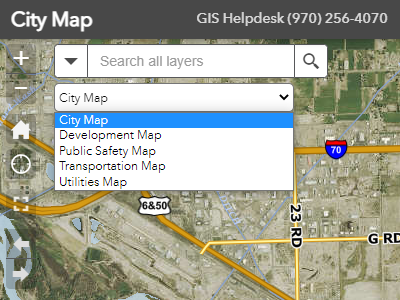
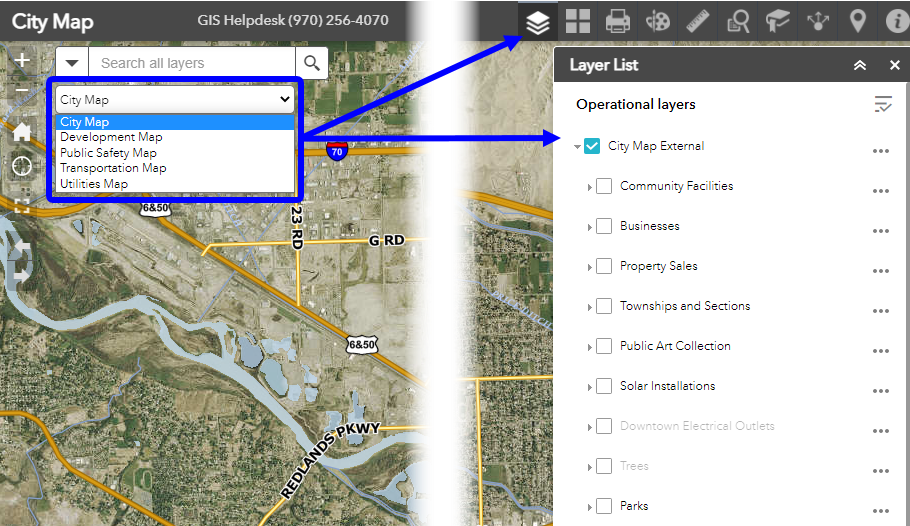
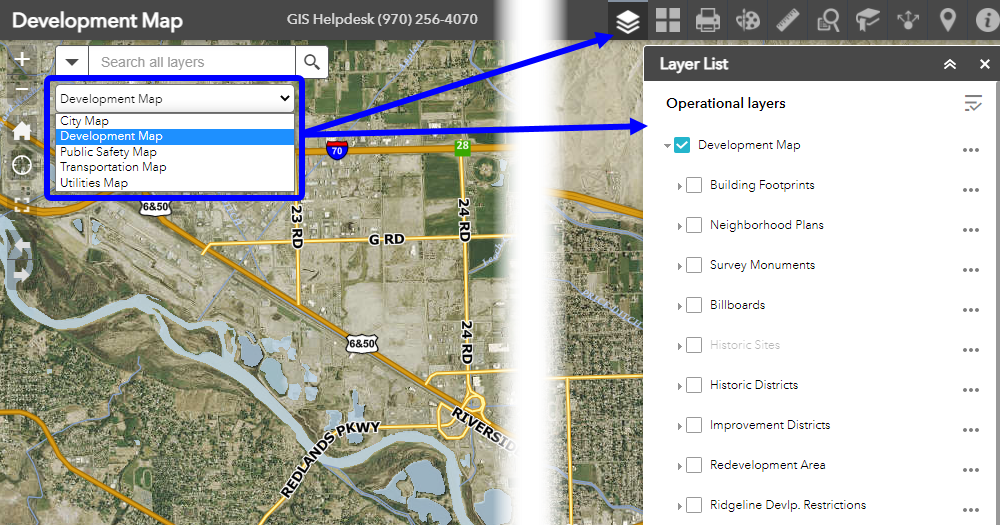
Located just under the Search Bar, in the upper left-hand corner of the desktop and mobile map views is the Switch Maps menu. To access different maps, simply click on the Switch maps bar and a list of available maps will appear, as shown in Figure 3.1. There is the City Map, Business Map, Development Map, Public Safety Map, Transportation Map, and Utilities Map.
Mobile View
Mobile View
The layer list is relative to the current map, so each of the maps will contain different layers that can be toggled on and off. Figures 3.2 and 3.3 compare the layer lists of the City Map and Development Map. On the mobile version of map view, the Layer List panel appears on the bottom of the screen. Switching maps and turning on and off layers behaves the same on desktop and mobile versions of the map.
MAIN TOOLBAR


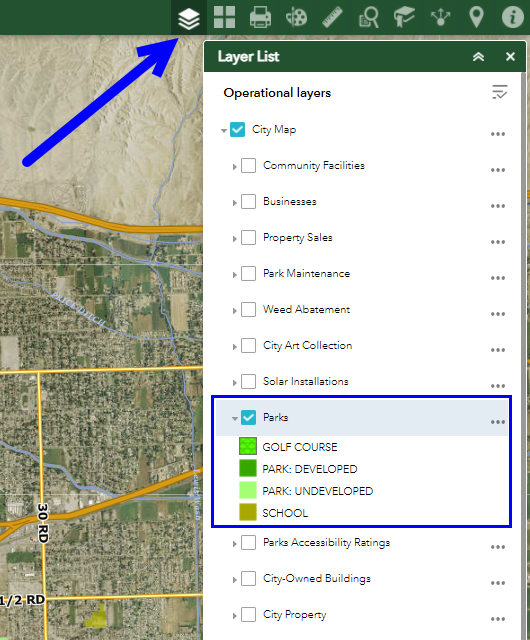
1. Layer List
Mobile View
- Located on the right-hand side of the screen on desktop map
views, and on the bottom of the screen on mobile map views.
- Allows you to turn on layers related to the map you have
selected. To turn on a layer, simply check the checkbox to the
left of the layer title (Figure 4.3). The layer’s legend will
expand below the layer title. In this example: Parks layer on
City Map.
NOTE: The following descriptions of the Main Toolbar buttons will only include images of desktop map views. All tool menus on mobile devices will appear as it does in the above description for Layer List - on the bottom half of the screen.
2. Basemap Gallery
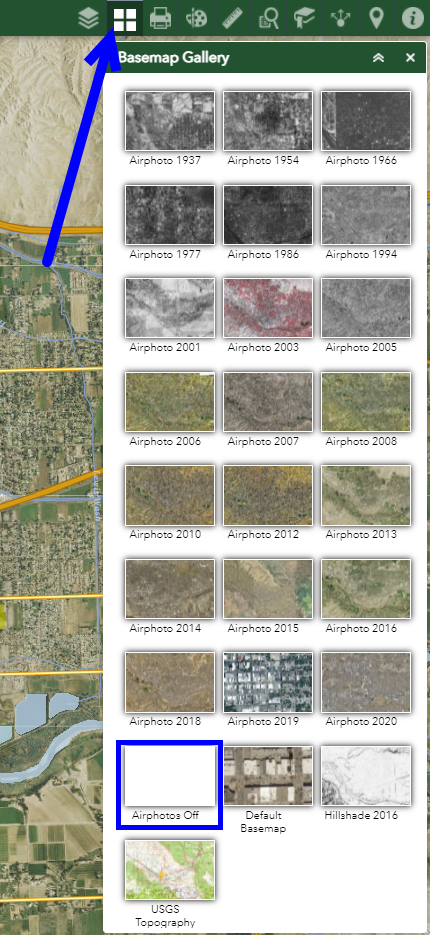
- This menu allows you to switch between different basemaps,
such as air-photos by year, hill-shade, and USGS Topography
map.
- You also have the option to turn off basemap images with the
‘Air-photos Off’ button, highlighted in Figure 4.4.
3. Print
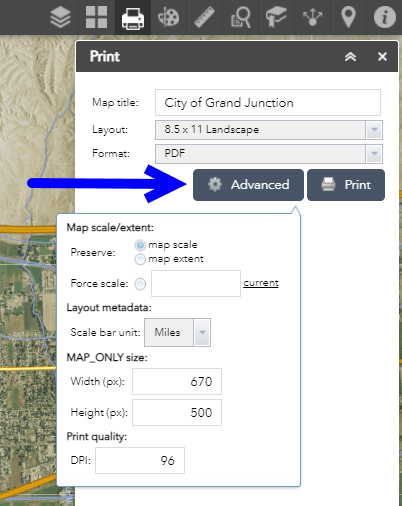
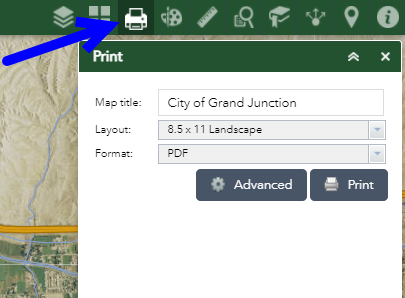
- The Print function allows you to save the visible map view to
a variety of formats (it does not actually send a job to your
printer).
- The ‘Layout’ dropdown menu changes the page size, and the
‘Format’ dropdown changes the file type, such as PDF, JPG, GIF,
etc.
- The ‘Advanced’ button allows you to edit portions of the
layout of the map, like adding a title, legend, and scale bar.
4. eDraw
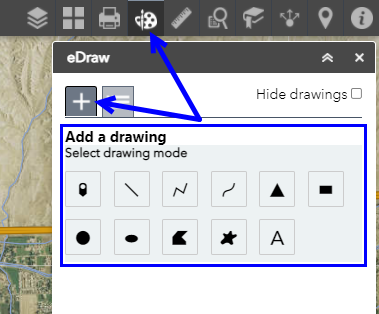
- There are 11 different drawing tools (Figure 4.6) you can use
to illustrate on the map, listed from left to right: Point,
Line, Polyline, Freehand Polyline, Triangle, Rectangle, Circle,
Ellipse, Polygon, Freehand Polygon, and Text
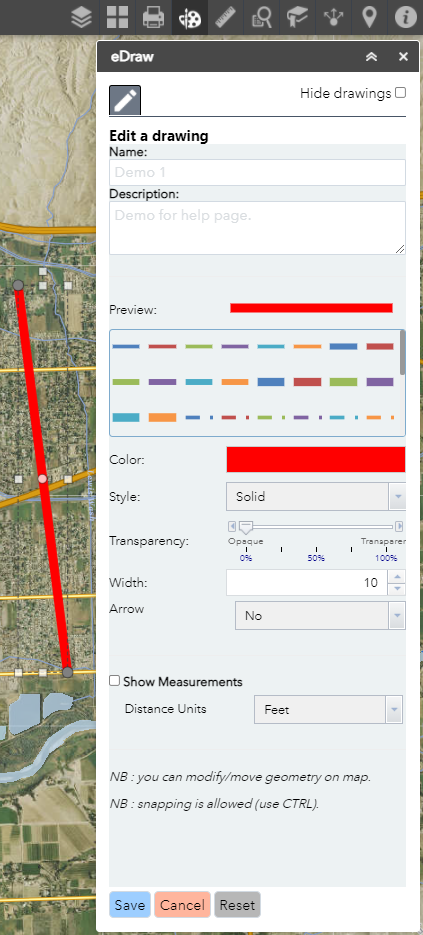
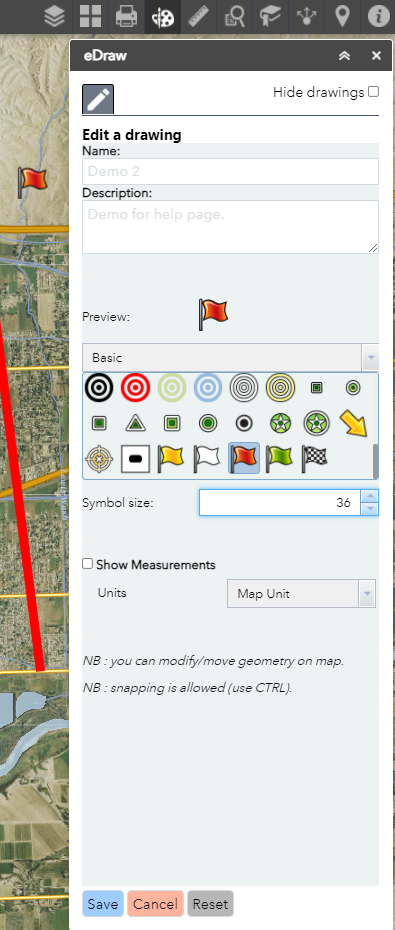
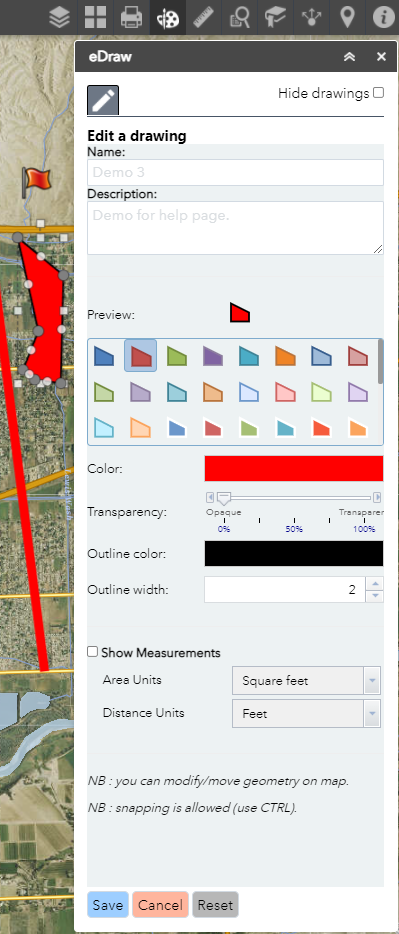
- Each drawing mode has properties to set that include different
colors, line widths, line styles, transparency levels, and
measurement units, etc (Figures 4.7-4.9).
- You can add names and descriptions to each drawing you make,
and you can adjust the units of measurement for your shapes and
show them on the map.
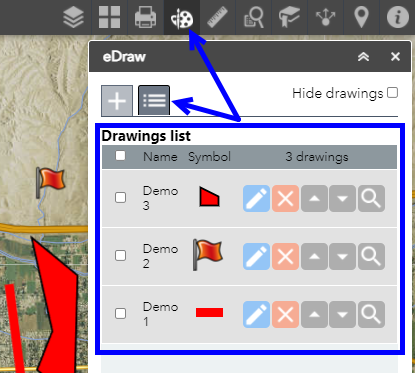
- In the Drawings List panel shown in Figure 4.10 you can edit
or delete existing drawings.
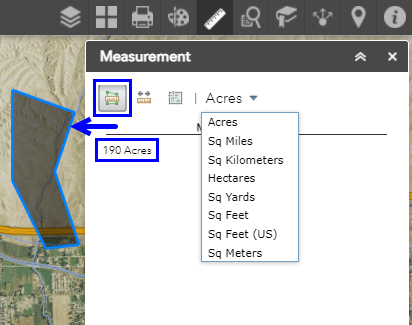
5. Measurement
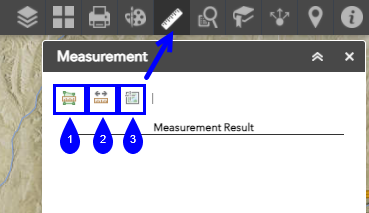
- The Measurement Panel has 3 main types of measurements, shown
in Figure 4.11:
1. Area (Figure 4.12) - The Area button allows you to draw
a polygon and measure the area inside of it. You can change the
units of measurement either before or after you have drawn the
polygon.
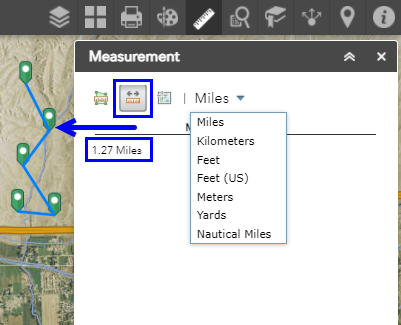
2. Distance (Figure 4.13) - The Distance function measures
the distance between two points. As with the Area and Location
buttons, you can change the unit of measurement.
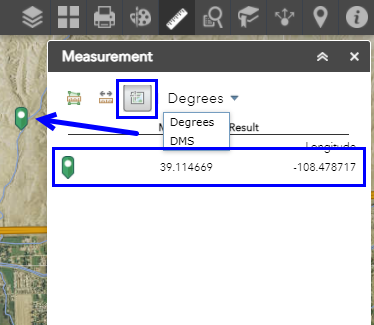
3. Location (Figure 4.14) - The Location function gives
you the coordinates of a point on the map in either Decimal
Degrees or Degrees Minutes Seconds.
NOTE: To finish a measurement, simply double click the
left mouse button anywhere on the map. To deselect a measurement
tool and pan around the map you must click the same measurement
button you had selected (i.e. if you were measuring area, click
the area button again).
6. Reports
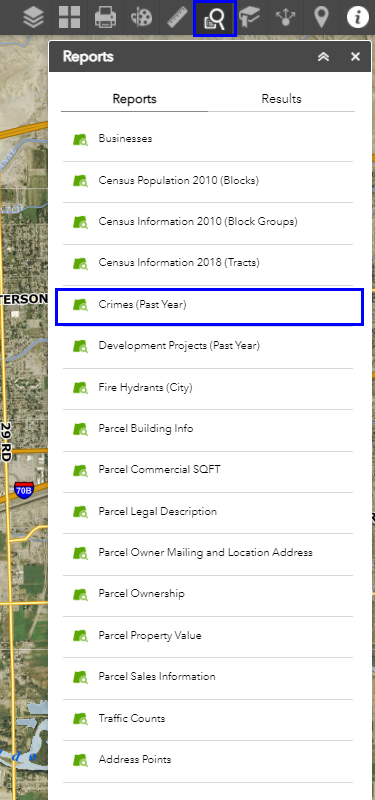
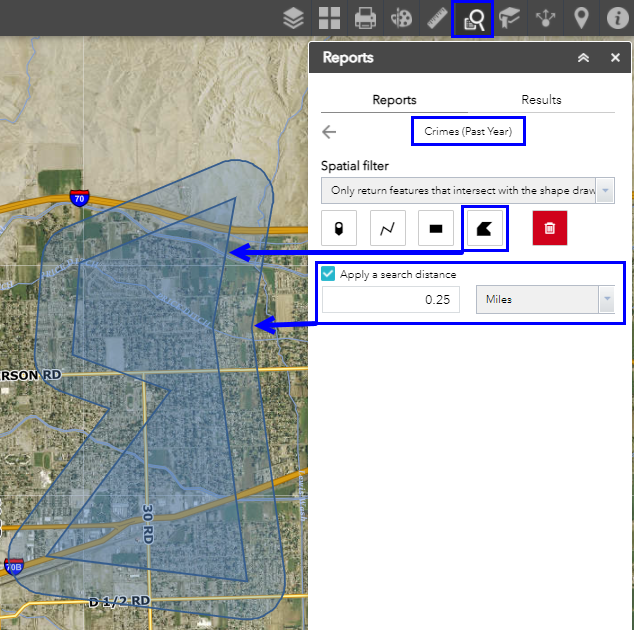
- The Reports function will generate summaries of a layer based
on the spatial relationship with a drawn area or with another
layer.
- First, select the layer that you want to run a report on from
the layer list in the Reports window, as shown in figure
4.15.
- Once a layer is chosen (in this example, Crimes, shown to the
left), the Spatial Filter options appear, as shown in Figure
4.16, giving you the option to draw a custom area, or search
based on the data in another layer. A search distance (buffer)
may be applied in various units.
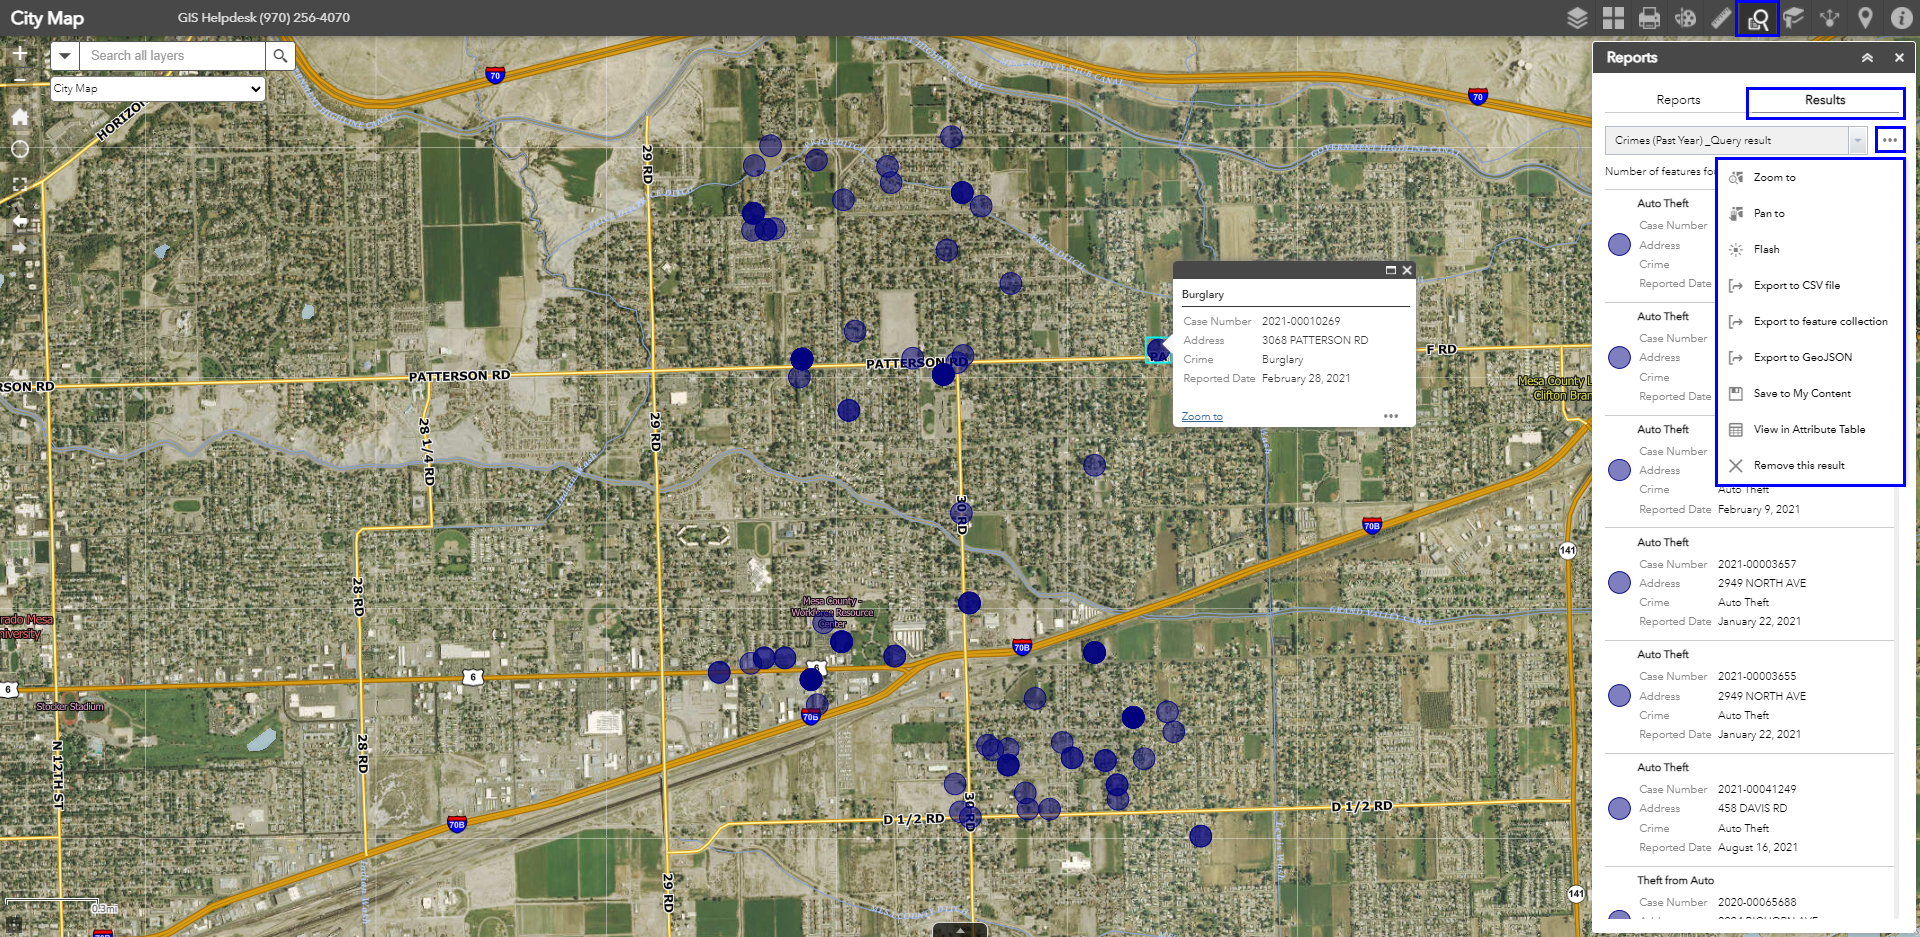
- The results will appear in the Reports window as a list, but
will also display as features on the map, as shown in Figure
4.17.
- To manipulate and download your report results, simply click
the ellipses in the top right corner of the list (highlighted in
Figure 4.17), and a small menu will appear with options to move
around the values in your report, remove the results, and to
export the report to a variety of formats.
NOTE: For questions about the more advanced functions of the
report tool, please contact the GIS Help Desk via the phone
number listed in the information tab.
7. Bookmarks
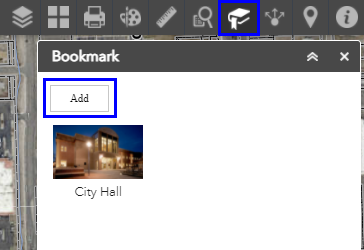
- Bookmarks save the extent and location of a particular spot
for you to easily return to on the map, City Hall is the default
bookmark as shown in Figure 4.18.
- To add a bookmark, zoom in to a desired location and click the
‘Add’ button, highlighted in Figure 4.18.
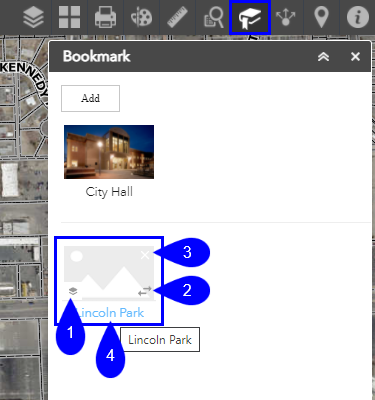
- After a bookmark has been added, you have the option to delete
it (3), change the thumbnail (2), and name it (4). For example,
here is one named ‘Lincoln Park’ in Figure 4.19 for easy
reference.
- 'With layer visibility' (1) is a useful feature for bookmarks
because, in addition to preserving location and extent, it
maintains any layers you have turned on in your map view (even
if those layers are later turned off).
8. Share
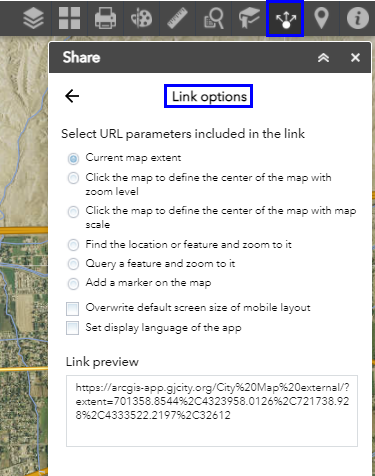
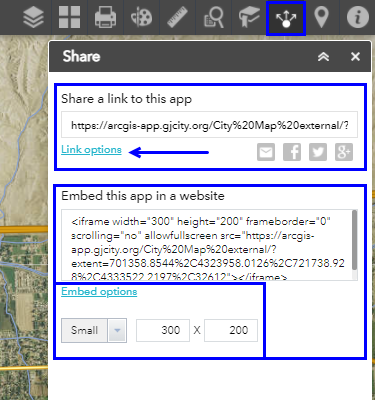
- The Share function allows you to share your map via a URL with
various options, or embed the map into a website with an
i-frame.
- Clicking on "link options" will take you to a separate panel
of options for you link, shown in Figure 4.21.
- Clicking on "Embed options" will cause any available options to
appear on the same panel, shown in Figure 4.20.
9. Pictometry
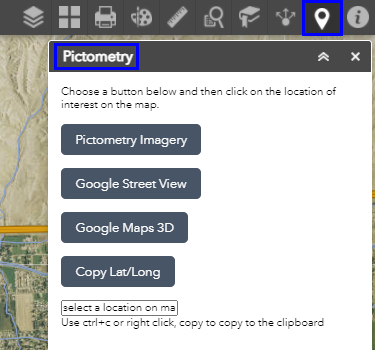
- Pictometry is a tool that allows you to view a location on the
map with various imagery. The Pictometry tool panel is shown in
Figure 4.22
- First, select from three different options of imagery:
Pictometry, Google Street View, or Google Maps 3D, and then
click a point on the map.
- A new tab will open with the selected imagery type of the
chosen location.
- The ‘Copy Lat/Long’ button retrieves the coordinates of a
location you have clicked on the map.
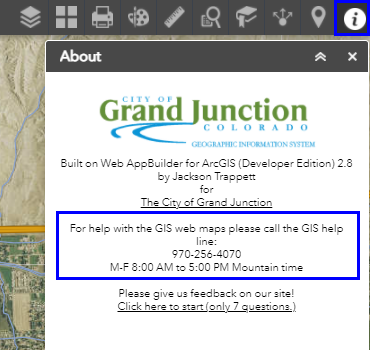
10. Information
- This button opens the About window which has contact
information and a link to the City of Grand Junction’s website
(Figure 4.23).
- Contact the GIS help line if you have any questions or
concerns about the web-map.
with contact information
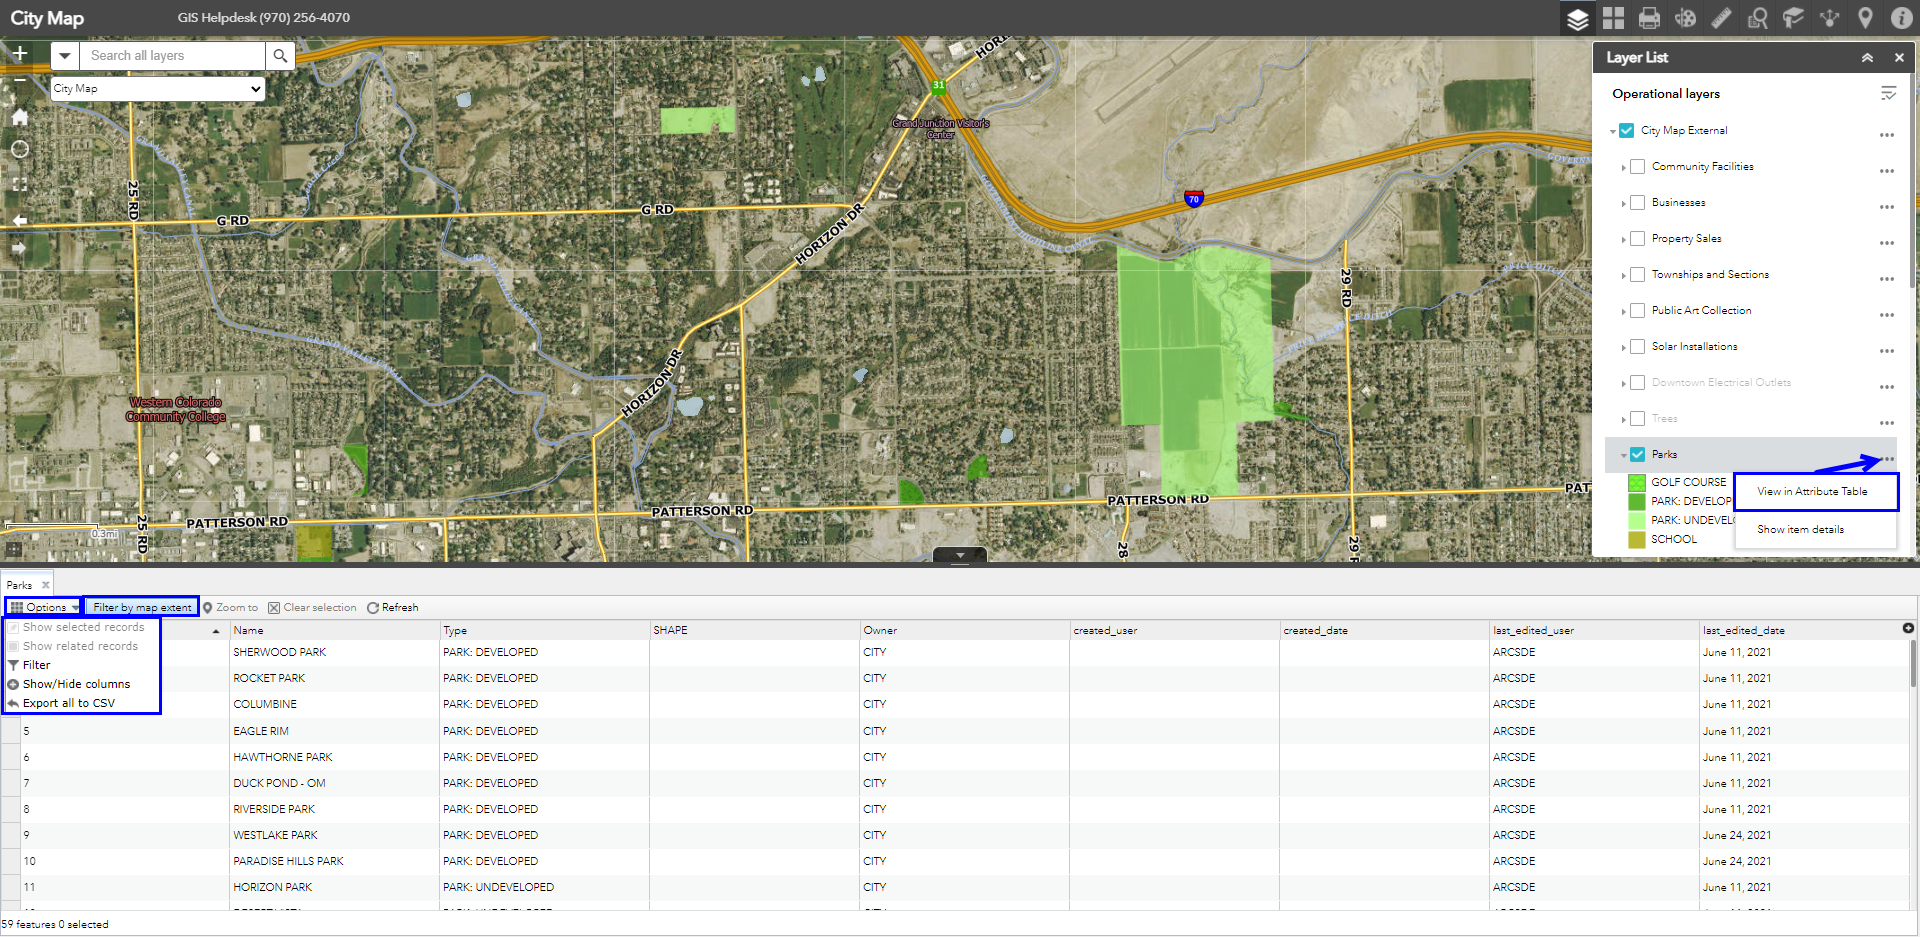
TABLE VIEWER
The table viewer function on the map view displays attributes from a particular layer in a table at the bottom of both the desktop and mobile versions of the map. To access table viewer, click on the ellipses on the right side of a layer, and select ‘View in Attribute Table’, highlighted on the right. The attribute table provides a list of every feature in that layer. The ‘Filter by map extent’ button can be used to toggle whether the table shows features not visible in the current map view. Deselect this to view all records in the table. To zoom the map to a particular record, either double click that row in the table, or click on the grey box to the left of that row and select the button ‘Zoom to.’ The ‘Options’ menu, located in the upper left corner of the table viewer features other functions like, Filter, Show/Hide columns, and Export all to CSV.
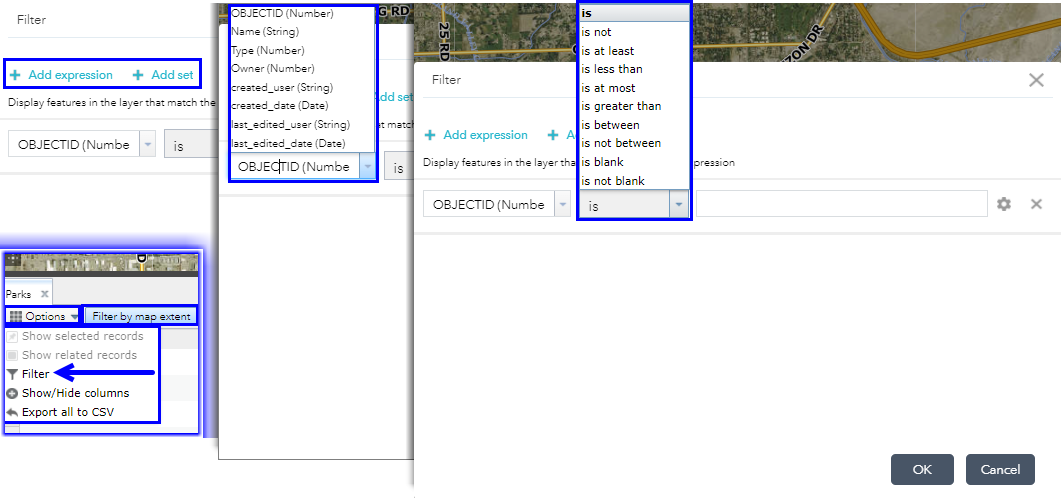
The ‘Filter’ feature opens the menu shown below. This allows you to
build a query to filter the table based on its fields. First, click
‘Add expression’. Choose the field from the dropdown list, choose
the operator, and enter the condition to be met. Click ‘Ok’ at the
bottom execute the query. This can be useful if you wanted to export
the table to a .CSV file, but only wanted features that had certain
qualities to be in the output table.
NOTE: The ‘Add set’ button allows you to string together
expressions to further narrow down results.
CONTACT
GIS Help Line:
(970) 256-4070
M-F 8:00 AM to 5:00 PM Mountain time